Using debugger with Adobe Flex builder


A lot of flash developer use Alert class for debugging or trace statements due to associations with Flash. Flex does have a true debugger and it is a great tool. I like to show you how to use it in this tutorial.

Compiler error is easy to spot and fix, it give you a red dot with X in it, also tell you where and why it is wrong.
Runtime error is harder to trace, debugger is create for developer to trace the runtime error, give developer a window to see what is going on while the application is running, what is the value is set to, what happen inside a loop, or why the if statement is not working. OK, lets get started.


Author: Willy Ci
Willy Ci is a Adobe Flex developer, he works with Flex over 4 years.

download code used in the tutorial here.

Before we start, here are some tools you needed


1)
Flash player debug version, Download them from here
this is tutorial I am using “the Macintosh Flash Player 10 Plugin content debugger (Intel-based Macs) (ZIP, 6.03 MB)”
To test which version of flash player you have go to here, (wrote by Peter deHaan, who got a great blog)


2)
Adobe Flex Builder 3, of course you need this, if not, get a free copy.
Free to all education customers.
https://freeriatools.adobe.com/flex/

Free to unemployed developers.
https://freeriatools.adobe.com/learnflex/


3)
other useful links you may like
samples with code
http://examples.adobe.com/flex3/componentexplorer/explorer.html
http://examples.adobe.com/flex3/consulting/styleexplorer/Flex3StyleExplorer.html

Adobe® Flex™ 3.3 Language Reference
http://livedocs.adobe.com/flex/3/langref/
http://livedocs.adobe.com/flex/3/html/index.html

Note


(screen capture are made on Mac, but should be same on PC)
My window prospective maybe different from what you have, you can find all the tabs from window menu.


Here is how I setup my views, you can setup anyway you like suites your need.


IF you are ready, let’s get stated!


Step 1 -- setup break points


I create a new flex project, very simple, one panel with two buttons in it.
Each button will call it’s click function,
b1_click() will run a loop, call update_Label() function,
b2_click() will create a runtime error, since there is no such thing as n_error value, but not compile error.


What is a breakpoint?
A breakpoint is set on an executable line of a program. If the breakpoint is enabled when you debug, the execution suspends before that line of code executes.


In order to suspend the application while it is running, you need set a breakpoint. It is easy to do, double click on the empty space next to the line number. Double click on it again to remove.

I set two breakpoints, on line 10 and 20, two blue dots show up, so if I click on button1, it will stop on line 10, click on button2 it will stop on line 20. (you can see all your breakpoints in the “Breakpoints” tab)
PS : Breakpoints can be add or remove any time you wish.

In the Breakpoints tab, you will see the list of all the breakpoints. Using the check box to temporary enable/disable breakpoint.


If you want to watch how the num is changed over time, highlights the value, right click, Select “Watch ‘num’ ”.


“num” now is add into Expressions tab


Step 2 start debug mode, and check some values


now we have everything setup, let’s start the debug section. Click on the icon looks like a bug.

or you select it from the menu


as the app start running, you can see it in the browser but nothing happens, what to do next? The break point is set inside the function, we need exectue the function.


To trigger it, click on “Button 1”, it will call b1_click() function. The app stopped at line 10, num still is 0 since the code "num += 1;" is not executed yet.
Look the Debug tab, some icon light up, and some values show up.


First lets take a look Variables tab, only few things,
This : include all the values in the application
Event : current event passed in
i : value defined in this function;


Open up “this”, a long list will show up, this list will getting longer and longer then you start look into it, and you computer will getting slower and slower,


since I know I want to focus on “button2.label”, let’s find it and right click select “Create Watch Expression”


Now take a look the Expressions tab, simple and clean, just the way I like it.
Two variables we are looking at now, “num” we created it early, and “this.button2.label”.


Step 3 using the Step controls


now lets take a look debug tab,
In this tab, you will see some icons are enabled now, and list of function name, components name.
in here it tells current it is in myLoop function,
component “button2” did an action “click” called this function.


what are those icon for? (you can find them in the menu -> run as well.)


When a thread is suspended, the step controls can be used to step through the execution of the program line-by-line.


Now remember them :
Resume – F8 key (not for Mac user, need some key change) continue run application.
Terminate – stop debug mode, application will keep running, but you can’t trace anymore.
Step Over – F6 key, go to next line of code.

Step Into – F5 key, if current line of code is calling other function, look into that function.
Step Return – F7 key, get out of that function.


F6 and F8 will be your best friends, remember them!
Here is what I do all the time, press F6, and keep my eyes on the Expression tab, see what is my value been change to.

Let’s press F6 few times


few more time, as you pressing it, the value of num is changing in the Expressions tab


If your loop never end, end early, sometime never get into the loop, now you can look into the action closely, see what is happen. Now we finished the loop, calling second function update_Label(), press F6 will step over it, but we want to see what happen in the update_Label(), you need press F5 step into.


Now we are in update_Label() function,


you can press F7 got back to myLoop(), value of the “this.button2.label” is changed.


let’s press F8 to resume the app. Now the button2’s label is updated.


Step 4 Read the error messages in debug session


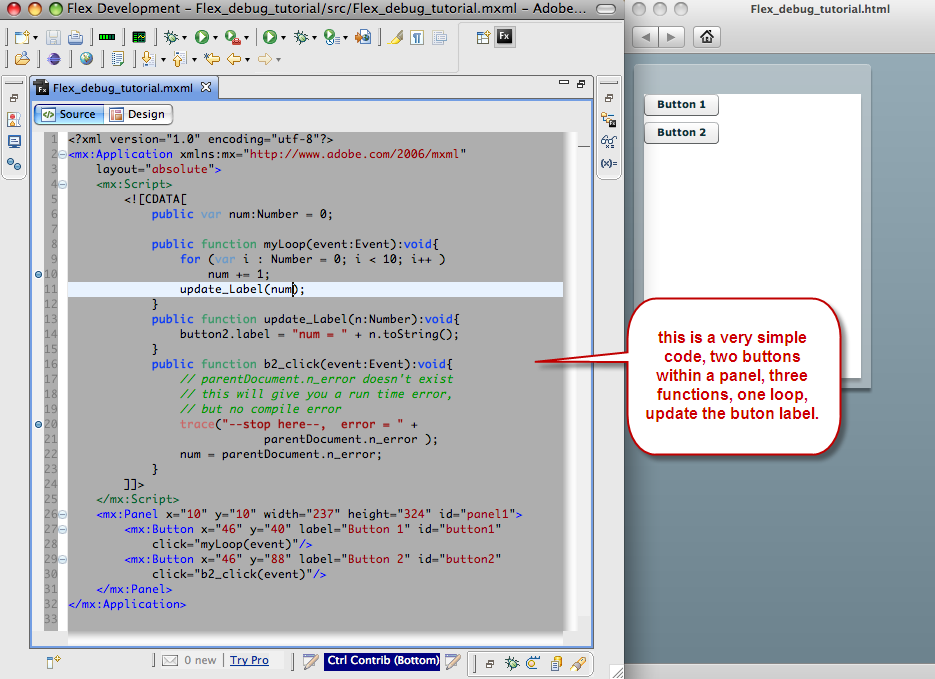
OK, new lest’ test the bug in the app.
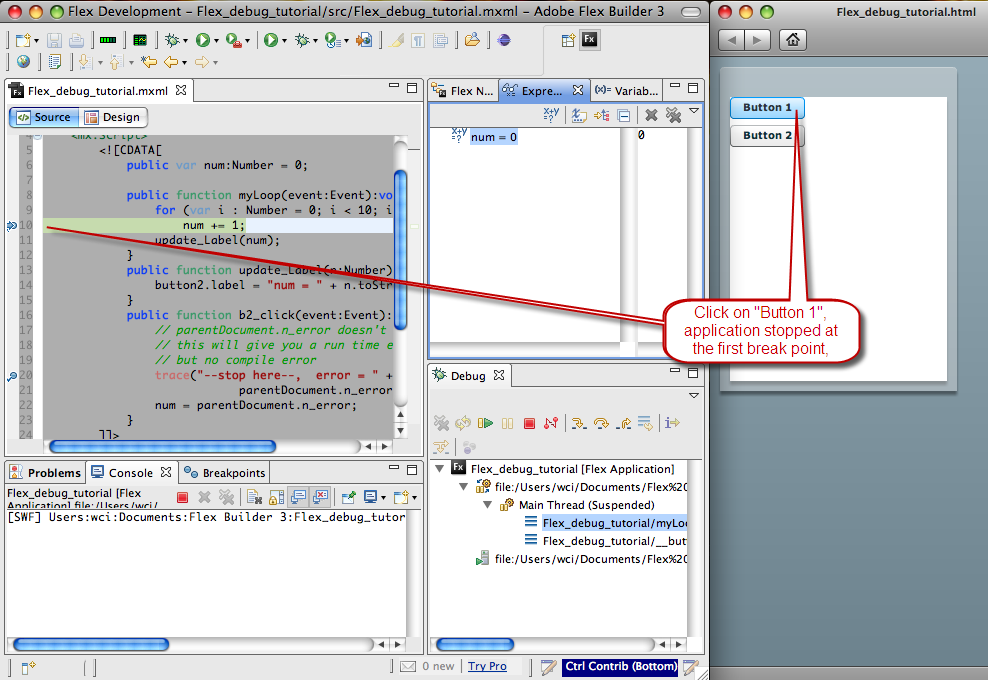
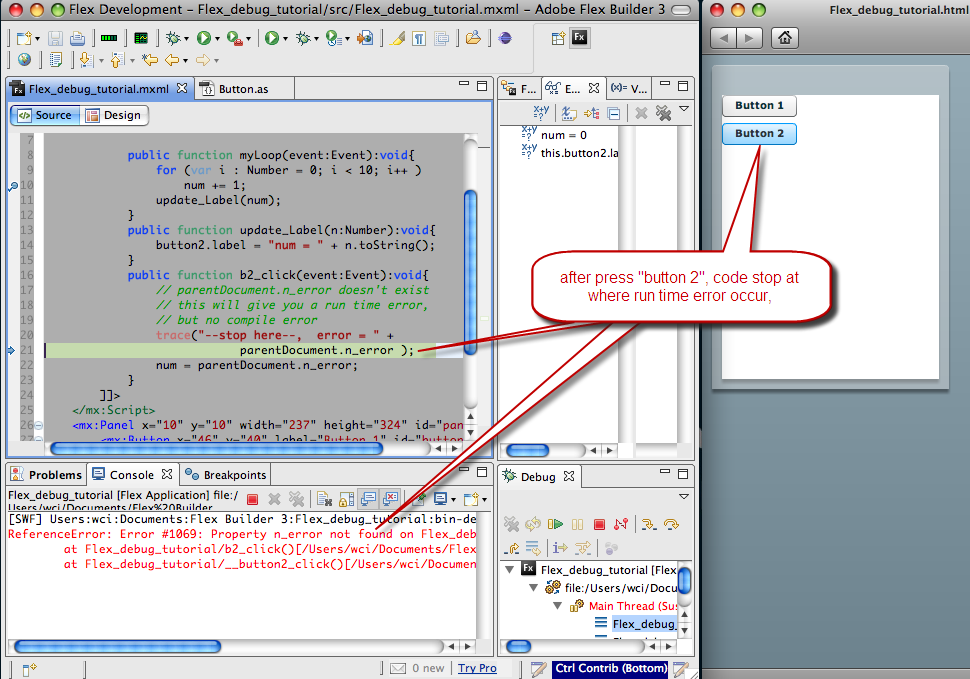
We know there is a bug in b2_click() function, let’s see it in action.
Click on “Button 2”, this will call b2_click() function, and app will stop at the error.


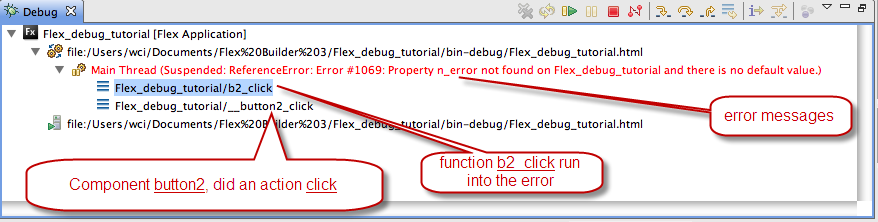
Take a close look at the Debug tab, in here it tell you what is the error, and who is calling.


here is what is display in the Console tab, it tell you more information about the error and line number where error occur


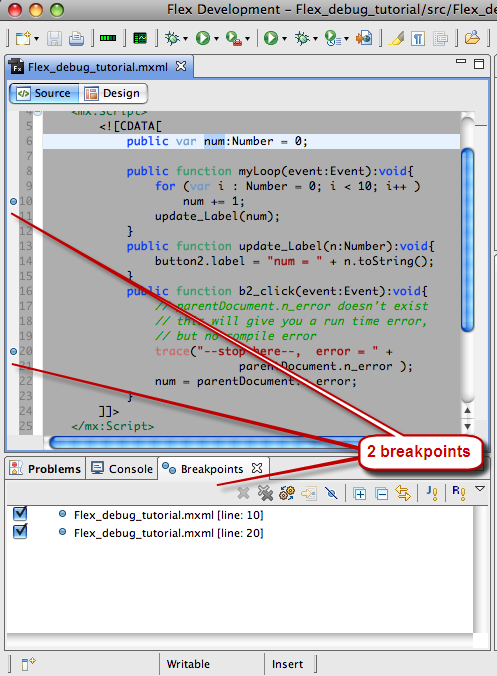
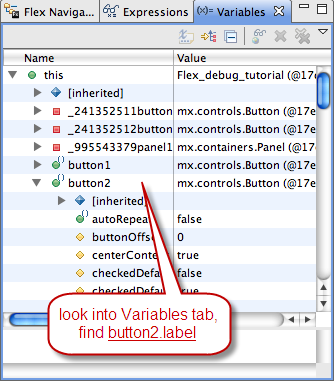
Step 5 Change values of variable


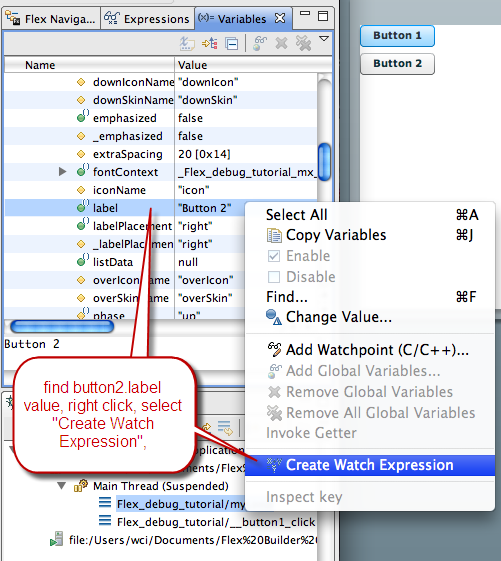
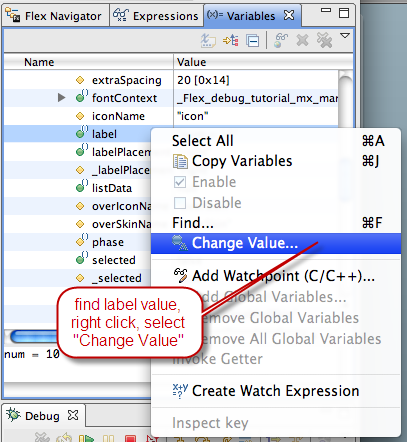
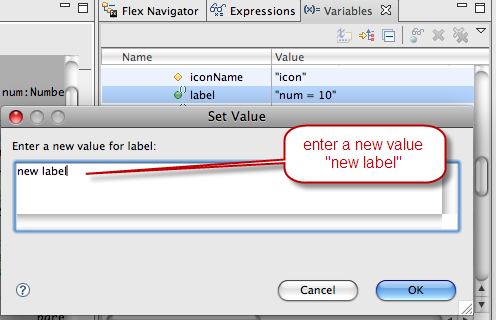
You can always change the value of variable, while the application is suspended, here is an example, if I want to change button2.label from “num = 10” to “new label”, here is how to do it.

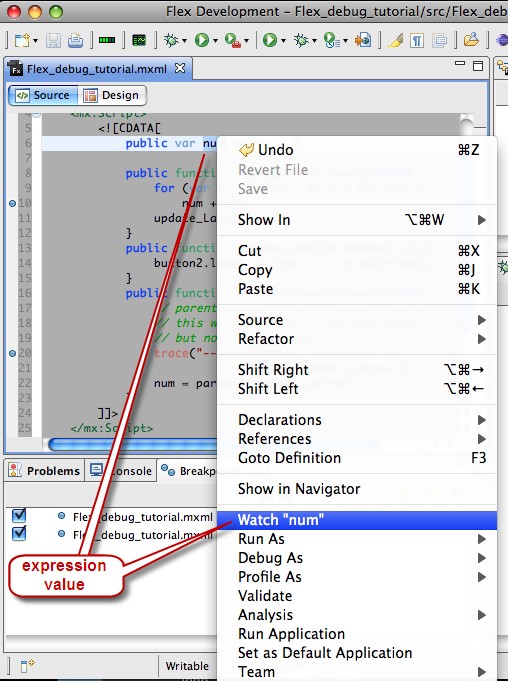
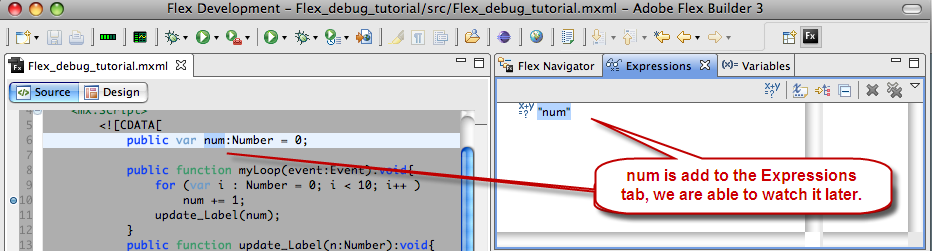
First find the variable label, right click , select Change Value,

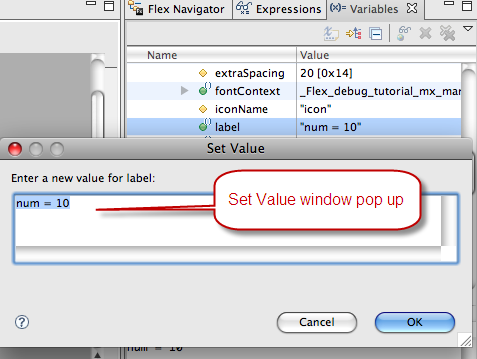
Set Value window pop up, and display the current value,


I am change that string to my new string “new label”, than press OK


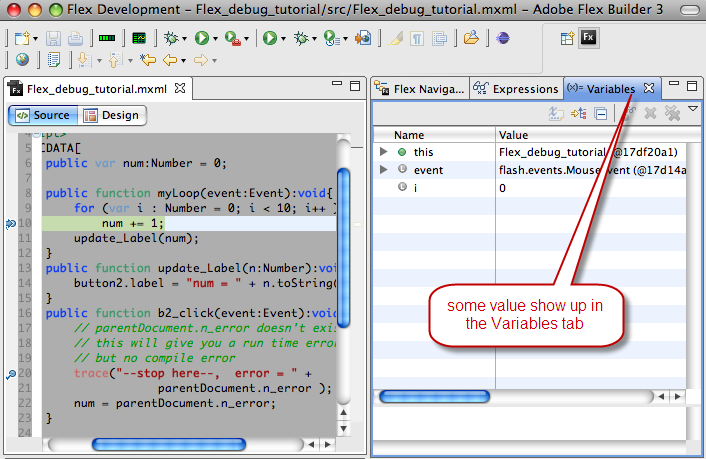
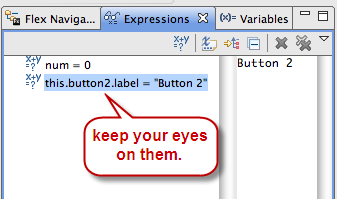
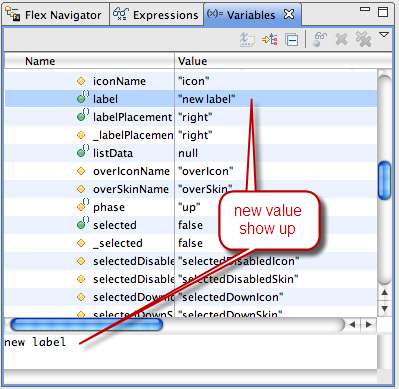
now in the Variables tab, the new value is set.


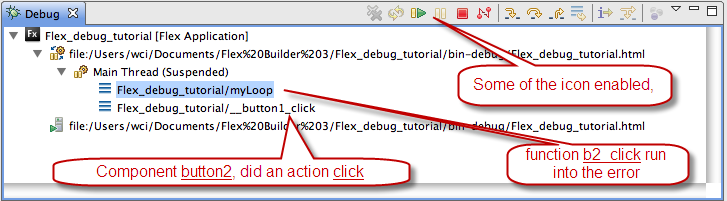
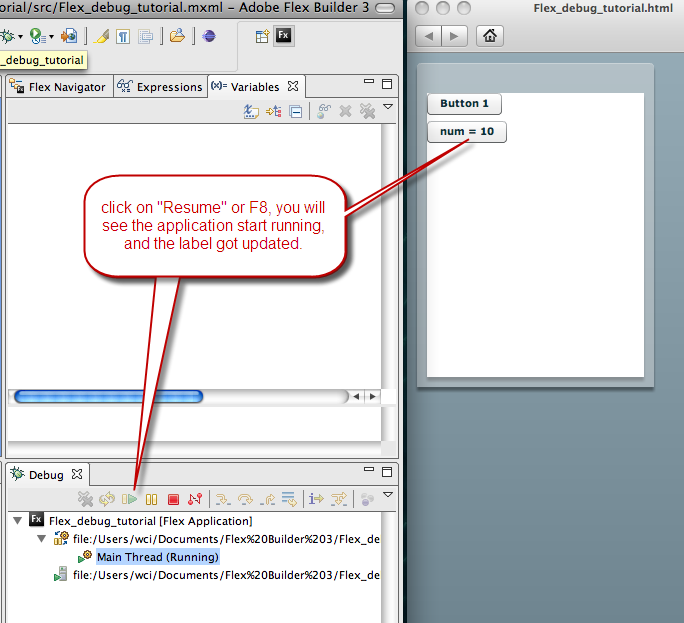
Resume the application, label is updated.


Conclusion


all right, now you know how to using the debugger!
Here is a quick summary
Double click Create a breakpoint,
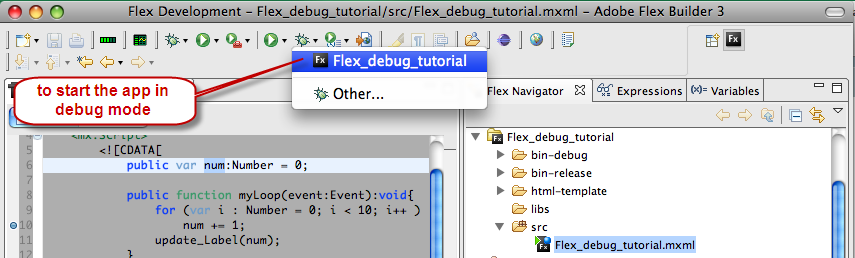
click on the bug icon start debug mode,
trigger the action to suspend the application
variables tab tell you what is the value
console tab tell you what and where is the error if any
debug tab tell you who called who and who did what,
and waiting for you to tell it what next action is.


If you think you are ready to testing your debug skill now, go try it on you own application now.
If not goto line 1.


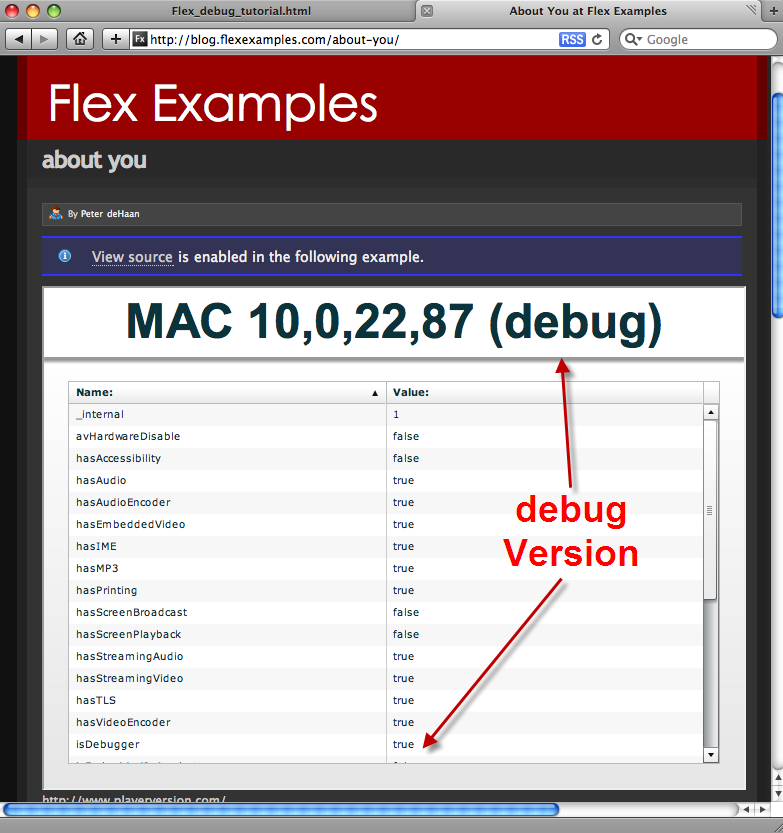
Here is a tip for who is new to Flex.


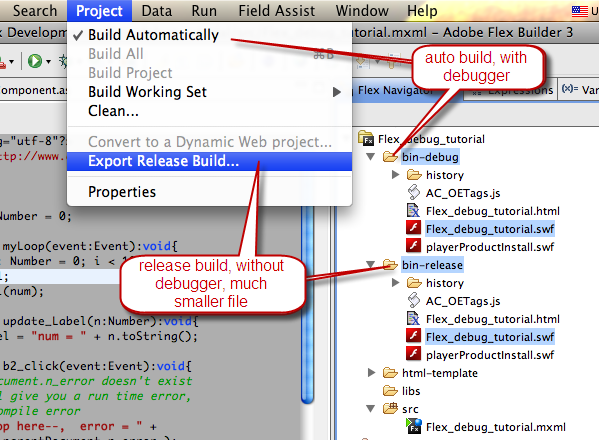
remember always export a release build, not the debug build, which is much bigger.